Now that you have links to all the FMR reports by mutual funds in Pakistan in one place, let us start explaining how to read them actually!
This guide will start by explaining what is an FMR Report. Why is it very important to follow them every month and How to read them?
Let's start!
To explain we have used Al Meezan Islamic Fund’s FMR to explain all the relevant and important information that the fund has disclosed about the investment.+
Understanding an FMR Report in Pakistan
What is FMR?
FMR, also known as Fund Manager Report is a document issued by mutual funds every month to share important information like the outlook on the fund, their fee, their monthly returns and performance vs benchmark and what do they own.
Through this report, fund managers give a peek into their thinking about the market, its direction and what should their investors expect in the future.
This makes FMR the most important report for investors to read.
Where to find FMRs?
Usually, these reports are available on their respective websites, under the download tab – sorted in descending order (latest first).
There are 19 mutual funds in total in Pakistan. Each asset management company has several funds to cater to different categories like stock funds, Islamic stock funds, fixed-income funds, income funds, and so on. So each FMR report will have details about all these funds. Scroll down to the one you are interested to read.
Since we are concerned about stock funds, we took Al Meezan Investments FMR as an example to show our readers how and where to find the most relevant information.
What to look for in an FMR?
Let’s see step-by-step all the important information that is available in the FMR.
1. Fund’s Name and Risk Profile
Three things to note here:
Which month is this report for? Investors need to find the latest and read in descending order (latest first)
Name of the fund – FMR consists of data for all the funds managed by an asset management company. Investors should select the one relevant to him
Risk profile: This fund is risky which means it has investments in stocks
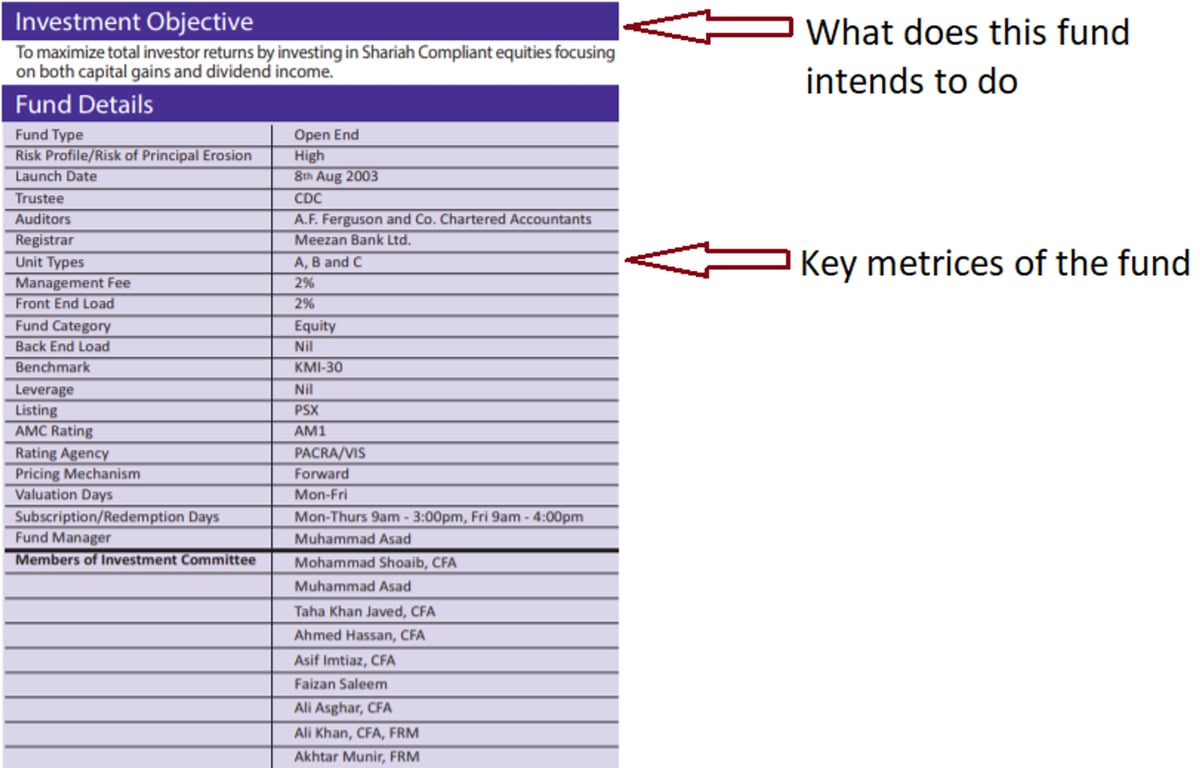
2. Objective and Fund Details
Objective: This section explains what the fund intends to achieve and how. It will also show the instruments the fund can invest in. In this example, the fund can invest in Shariah Compliant stocks only
Fund Details: This is one of the most important sections and investors should study it thoroughly. It includes important information like Management Fees, Front or Back-end loads, instruments they invest in through this fund like stocks or Sukuks, and the management team.
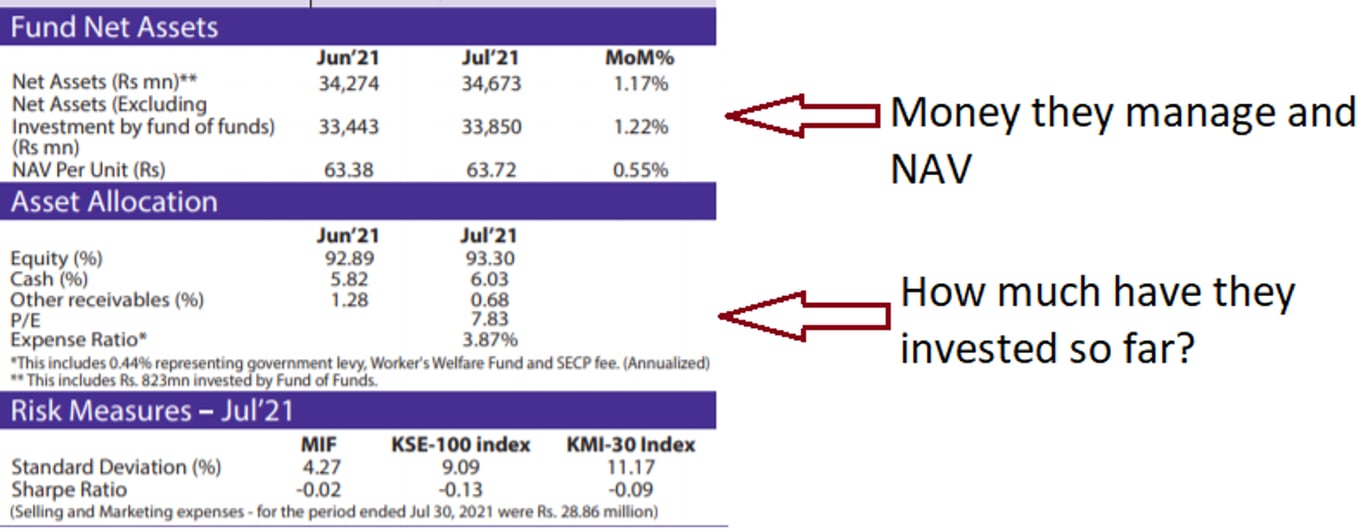
3. Funds and Allocation
Net Assets: This shows how much money this specific fund is managing and its growth. Higher funds under management and their growth, show that investors trust this fund and its managers. In this case, the fund has Rs34.6bn of public money invested with them and the number grew 1.17% over the month.
Asset Allocation: This explains how much are they invested vs how much cash they hold. This varies from fund to fund and depends on their analysis of the market’s future performance. Higher cash also means that the fund has space to buy more stocks if the market comes down and vice versa while losing out on returns if the market moves higher.
Expense Ratio: Their expense ratio is 3.87% – which is at the lower end of the spectrum. However, looking at the underperformance of 3.82%, it looks like they didn’t justify this fee during FY21. (more on it below)
4. Holdings and Sector allocation
This is the most important section which shows top holdings and sectors. This is very beneficial for existing investors as they can select funds according to their view of the market. For instance, if one expects cement to perform in the coming months, they can choose a fund having the highest allocation to the cement sector.
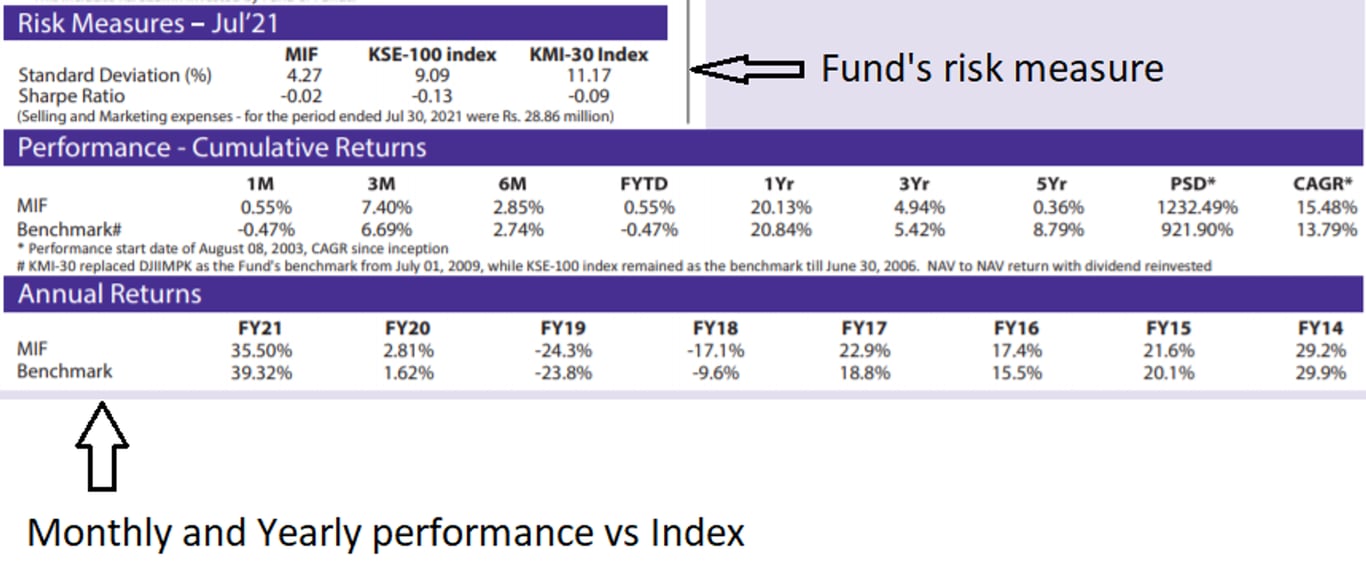
5. Risk measure and performance
The standard deviation shows the fund’s volatility vs Index (detailed read on it here).
Sharpe ratio: Every penny of return one makes vs the risk he takes to make that (detailed read on it here.)
Performance: The other two tables show the fund’s performance vs benchmark. In this example, this fund is outperforming the benchmark in almost all the mentioned periods i.e., 1 month, 3 months, and 6 months. However, for the entire financial year (FY21), they have underperformed their benchmark by 3.82%.
Now you know how to read an FMR Report!
If you want to read answers to the most asked questions about mutual funds, here is the link.
If this is still confusing, drop us an email at [email protected], and we will help you find a fund that best matches your needs.
Don’t worry about any fees – it’s all free!😊
Happy Investing!
This article only scratches the surface. Subscribe to our newsletter and explore the full spectrum of expert insights and practical tips to expand your financial horizons. Link ⬇️
Founder at InvestKaar.com. 15 years of investing and wealth management experience. Worked at most renowned brokerage houses in Pakistan. Won the best sales trader award for 2021 by CFA Society of Pakistan.